Composite Bridge Design - Sinaia Road Passage
Please fill out the Download Section (Click here) below the Comment Section to download the Full Webinar PDF File.
Table of Contents
*Click the content to move to the section
1. Introduction
2. I-Girder Solution
3. Tub Girder Solution
4. Double Tub Girder Solution
1. Introduction
Feasibility studies in the construction sector are preliminary studies done at the beginning of a project. Since construction projects require huge time and money investment, it is important to establish if the project will be feasible at a very early stage. The purpose of this phase is to find the most appropriate solutions, in economic and technical terms, among many. The bridge object of this webinar is a part of a feasibility study aimed to realize an overpass in a populated area of Sinaia, in central Romania. The overpass studied is located near buildings and over an important intersection, making the realization of the work an interesting engineering challenge.
Three solutions will be studied, gradually adapting the structure to the evolution of the environmental requirements, in particular a double I girder section, a single tub girder section, and finally a double tub girder one. Due to a span length of more than 50 m, a composite steel-concrete section is adopted. Composite structures are characterized by a steel structure fixed to a concrete one, so that both materials act together, reducing deflections and increasing strength (Figure 1‑1). This is done using 'shear connectors' fixed to the steel beams and then embedded in the concrete. Composite bridges are an efficient solution in terms of weight and cost for intermediate spans, between 40 and 100 m. Composite bridges have some important advantages:
- Reduced weight in relation to resistance;
- Ease of execution;
- Adaptability to different decks geometries;
- Aesthetic and architectonic quality;
- Durability
The most common types adopted are the double I-girder and the tub or box girder. The double I solution is the simplest one and his ratio L/h (span length on the height of section) is in the order of 22-28. For closed sections, the ratio is about 50.
 Figure 1-1. Effect pf connectors in composite structures
The first solution studied is a double I girder composite bridge (Figure 2‑1), the simplest and also the cheapest one. This type of bridge is the most common, consisting in two I girders with, in general, cross beams not connected to the slab.
 Figure 2-1. Example of double I-girder and transversal section of the first solution
The structure is modeled as a simply supported beam with a single span of 55 m. In this model, the substructure is not considered, and the deck is simulated with a grillage model. Variable loads are calculated according to Eurocodes and Romanian CR: the wind load is calculated according to Eurocode 1-1-4, section 8, where a simplified method is proposed. The wind force is a function of air density, wind speed, and a factor that depends on the zone where the structure is located. When the wind is combined with traffic a further exposed surface is considered because of the presence of vehicles. The Romanian code provides a map in which the wind pressure is already defined based on the district in which the structure is located (Figure 2‑2).
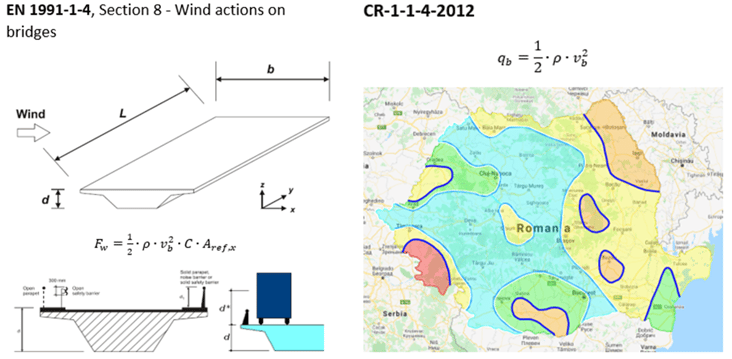 Figure 2-2. Wind actions according to Eurocode and map of wind pressures in Romania
For temperature loads, the Romanian Annex provides some maps that define maximum and minimum temperatures for each zone of the country. Knowing the location and the type of deck, then using the plot in Figure 2‑3, we can find the uniform temperatures to apply to our elements in Midas.
 Figure 2-3. Uniform temperatures according to Eurocode and National Annex
Other than the uniform component of temperature, we must also define the temperature gradients caused by the difference of temperature between the exposed parts and the one in shade. In Figure 2‑4 we have some standard values for composite bridges, valid also for Romanian codes, and some corrective factors depending on the wearing surface of the deck (Figure 2‑5).
 Figure 2-4. Temperature gradients for bridges according to Eurocodes
 Figure 2-5. Wearing depth factors
The Eurocode defines some rules for traffic loads in road bridges. The first thing to do is to define the notional lane, depending on the width of the deck. The distribution of notional lanes is the one in Figure 2‑6.
 Figure 2-6. Notional lanes according to Eurocode 1998-2
Values of the axle and uniform loads of Load Model 1 and Load Model 2 are in Figure 2‑7. LM2 is more significant for short-span bridges of 3÷7 m. In midas Civil we can use the “moving load optimization” function that, using the influence line method, allow us to find the most onerous configuration examining all the possible positions of the load. These vertical traffic loads need to be combined with horizontal traffic loads, creating the groups in Figure 2‑8.
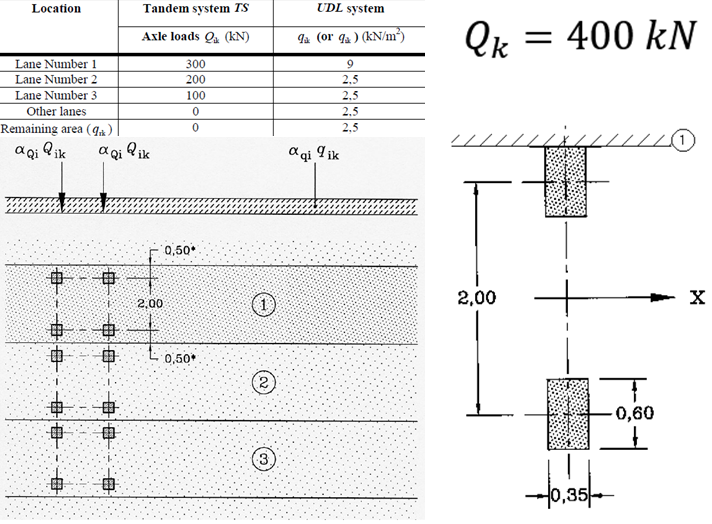 Figure 2-7. Load Model 1 and Load Model 2
 Figure 2-8. Groups of traffic loads according to Eurocode
The most important traffic horizontal forces are braking (or acceleration) and centrifugal force. The braking force is a fraction of the vertical load of the first lane of LM1, and it’s applied at the level of the carriageway. The acceleration force, instead, has an opposite longitudinal direction relative to the braking one, but the same value, calculated as follows:
 The centrifugal force is present in the case of curved bridges and is a force acting at the level of the carriageway in the perpendicular direction with respect to the axis of the bridge. It is dependent on the radius of the curve and on the axle load of LM1 (Figure 2‑9).
 Figure 2-9. Values of the centrifugal force according to Eurocode
In the first midas Civil model, beams and slabs are realized with line elements (see Figure 2‑10), a very common and simple modeling technique that quite well simulates the behavior of the structure.
 Figure 2-10. Grillage type model
Supports are arranged in a way that allows thermal expansions in both horizontal directions, releasing the degrees of freedom as shown in Figure 2‑11. In this way, we prevent stresses due to uniform temperature.
 Figure 2-11. Scheme of supports
Wind load is applied for both Y directions, with an eccentricity calculated considering the presence of vehicles on the carriageway, driving up the point of application of the force. The maximum and minimum uniform temperature load are applied on all elements while the gradient is applied only on the beams, both when the top side is warmer than the bottom and vice versa.
The traffic effect is modeled with the “Moving load optimization” function, which automatically finds the most onerous disposition of the lanes in the transversal direction. As we can see in Figure 2‑12, the width of the carriageway is 4.5 m and the vehicular load distribution is through crossbeams (consisting in the “Slab” structure group made of the transversal concrete elements).
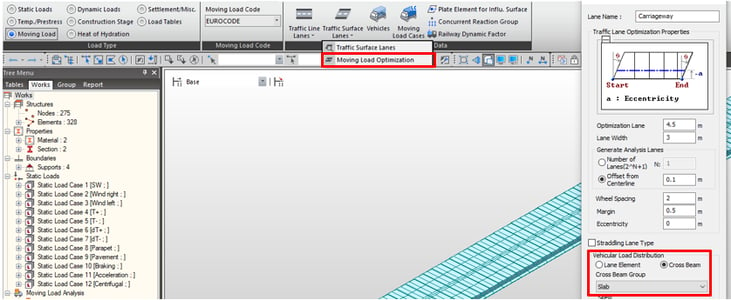 Figure 2-12. Moving Load Optimization with cross beams
We define characteristic Moving Load cases (Figure 2‑13), needed for group 1a and group 1b, and a frequent combination. This is created to be applied together with horizontal traffic loads for group 2, as specified in Eurocodes. No crowd load is required in this project.
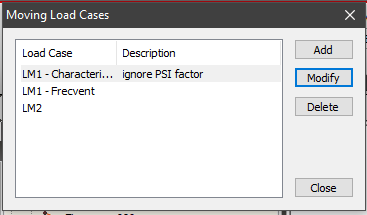 Figure 2-13. Moving load cases
Braking and acceleration loads are applied opposite in direction and distributed in the longitudinal direction where the first lane is supposed to be. Centrifugal force is calculated since this bridge has a radius of curvature of 170m. All these horizontal forces are applied at the level of the carriageway, applying an eccentricity in the Z direction.
The first result checked is the “moving tracer”, which shows the most onerous disposition of traffic loads for each element. This is also a sort of test for the accuracy of the model: for example, in Figure 2‑14, we can check the consistency of characteristic LM1 and LM2 and frequent LM1 configuration for a middle span element.
 Figure 2-14. Load distribution for a middle-span element for LM1 and LM2
Another check is the efficiency of supports scheme, ensuring that uniform temperature load does not give any effect on forces (Figure 2‑15). In Figure 2‑16 we can look at the effects of the main loads.
 Figure 2-15. Effect of the uniform temperature
 Figure 2-16. Some examples of bending moments and deformed shapes
3. Tub Girder Solution
With this first model, considering the whole deck package, we reach a section of about 1.6m in height.
Due to the presence of the intersection below, we had limited space. In addition, the ramp needed to be shortened since, in the first version of the project, it got too close to some buildings near the road. This further reduced the available clearance, making the first section no more suitable. The proposed solution was a continuous girder with a single tub section as the main beam (Figure 3‑1), keeping a central span of 55m.
Tub and box girders are more expensive and complex to realize. The difference between a box and a tub section is that the second one is opened in the upper part. These kinds of sections have the advantage of a reduced height compared to resistance, as well as a great resistance to torsion. Closed sections are economically viable only for reduced deck widths, and for our project seemed the perfect solution due to the limited space and the reduced dimensions of the bridge deck.
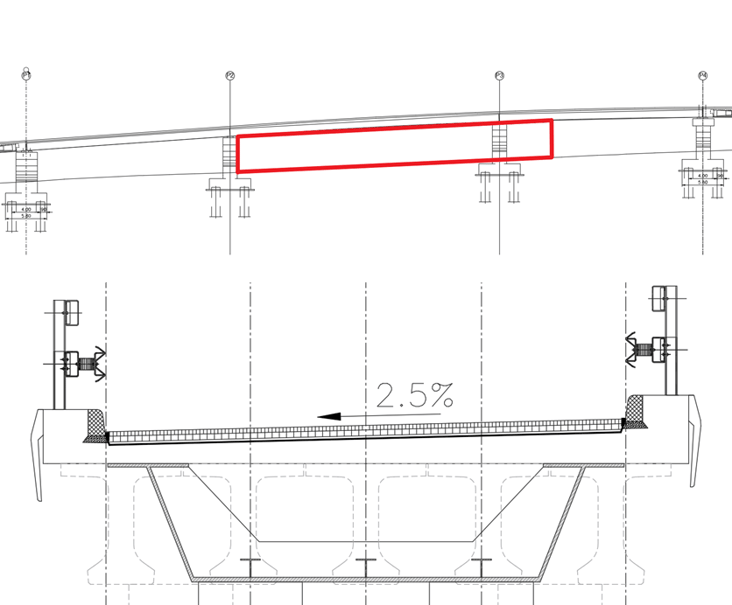 Figure 3-1. Longitudinal profile with available clearance and cross-section of the second solution
In this phase, substructure has been modeled in midas Civil and the effect of seism has been analyzed. The Romanian code P100, which is included in the program, provides some maps (shown in Figure 3‑2) to identify the location where the structure is, obtaining then the values of the corner period Tc and the acceleration at ground level ag. Knowing these two parameters, we have almost all the ingredients to execute a response spectrum analysis.
 Figure 3-2. Tc and ag maps for Romanian code P100
The Eurocode 8 part 2 requires a behavior factor for limited ductile piers equal to 1.5. Modal shapes have been combined through a Complete Quadratic Combination, expressed by the following equation:

This combination is more suitable for multi-span bridges with respect to SRSS, which is more commonly used but tends to overestimate or underestimate the results in a system with close natural frequencies.
The bridge has 3 spans of 20 m, 55 m, and 20 m. The main girder is a composite steel tub section, with a total height of the steel part of 1.2 m, while the whole slab is included directly in the section. Due to its width of nearly 3 m, we add some T stiffeners in the bottom flange to prevent local buckling. The piers are modeled as a plate element with a thickness of 2 m and fixed to the base. The connection between the beam and the substructure is realized with elastic links, freeing the longitudinal direction to allow the thermal expansion.
 Figure 3-3. midas Civil model for the second studied solution
Since in this model there are no transversal elements and just a single girder, is more appropriate to use the moving load optimization with a lane element distribution (Figure 3‑4).
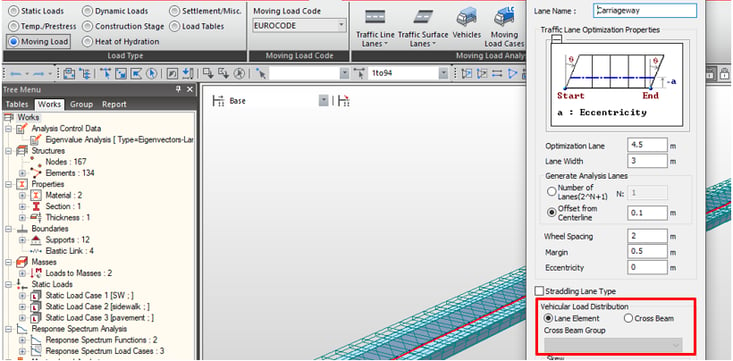 Figure 3-4. Moving Load Optimization with "Lane element" vehicular load distribution
Analyzing the seismic behavior of the structure, it is important to check in the structure tab the “Convert self-weight into masses” option; here we can choose to consider the masses as concentrated or, for a more accurate model, as distributed (Figure 3‑5, on the left). On the other side, the consistent mass option is available only with the Lanczos eigenvectors method, which sometimes is not efficient to reach the 90% of modal participation mass as required in EN1998-2.
Permanent loads are converted in masses through the function “load to masses” (Figure 3‑5, central picture), to take into account these forces in the response spectrum analysis.
 Figure 3-5. Setting for mass properties of the structure
In RS functions we choose the P100 Romanian code and horizontal and vertical design spectrum: in the zone of Sinaia, we have a Tc equal to 0.7 s and a ground acceleration of 0.3 g. Other parameters are importance factor, which for a strategic structure is 1.4, and the behavior factor, taken from the Eurocode, equal to 1.5. Figure 3‑6 are shown defined spectrum functions.
 Figure 3-6. Horizontal and vertical design spectrum according to Romanian code P100
We have then defined three RS load cases for the three directions of the seism, as in Figure 3‑7. Here we can choose the way we want to combine the modes: a preliminary operation before defining RS load cases is to define the number of modes that we want to be considered by the program in the Eigenvalue analysis options (Figure 3‑5, right), otherwise here we won’t have any mode to combine. We choose the CQC combination since we expect close natural frequencies between modes. Note that, in the operation of combining modes, we lose signs. Midas Civil gives the possibility to choose a method to assign them: “Along the Major Mode Direction” uses the sign of the major mode. In cases where torsion is significant or the modes are closely spaced, it is more appropriate to use along with the Absolute Maximum Value option. In any case, in our project we left this option unchecked, being more conservative and leaving resultant forces in absolute value (Figure 3‑7, right).
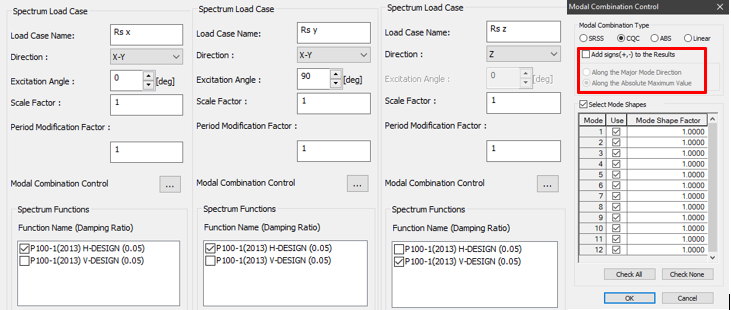 Figure 3-7. Dynamic load cases and mode combination settings
In the Results, we can check the modal shapes, together with the associated frequency, natural period, and effective modal mass. Periods look, in general, quite close.
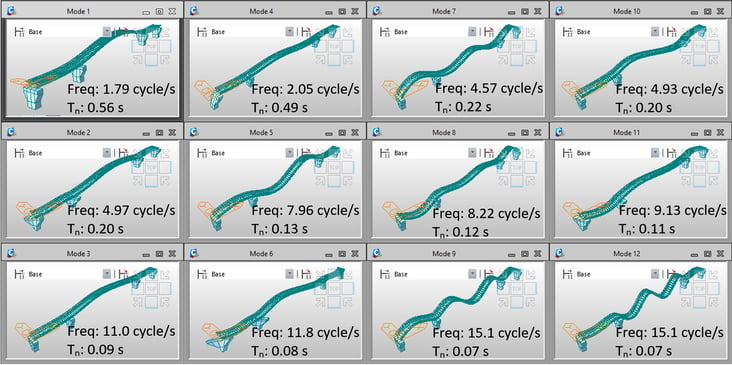 Figure 3-8. The first 12 modes of vibration of the structure
Looking at the modal participation masses in Figure 3‑9 (1) we can see that these are not enough to reach 90% in each direction. It is necessary to analyze the frequencies up to mode number 645 to satisfy the Eurocodes requirements, as shown in Figure 3‑9 (2).

In Figure 3‑10 we can see the moments on the deck due to the Seism in the vertical direction and the plate forces acting on piers for the horizontal directions.
 Figure 3-10. Forces on deck and piles for vertical and horizontal earthquake direction
A serious topic for metallic structures is lateral-torsional buckling. In composite sections, generally, the slab connected to the steel flange partially mitigates the problem, acting as a constrain for the section which is not free to deform laterally. However, there are two ways this phenomenon can be dangerous for composite bridges: the first occurs in continuous bridges, where the negative moment can compress the lower flange, that is not constrained by the slab; the second one can occur during execution when the steel section is alone and we are casting the concrete of the slab. The buckling resistance of the steel member depends on its slenderness, which is a function of the Critical Elastic Moment:

European codes provide some closed-form solutions to calculate this parameter, but they all refer to double symmetrical sections and mono-symmetrical T sections:
 Double symmetric sections
 Mono symmetric T sections
For tub girders, the only way to calculate the Mcr value is through a Buckling Analysis, and Midas can help us in this. The model used is made importing a section from AutoCAD as a line element and then extruding it to realize the girder as a plate element Figure 3‑11 (1).
.png?width=725&name=Figure%203-11.%20Extruded%20structure%20and%20notional%20load%20for%20Buckling%20analysis%20(1).png) Figure 3-11 (1). Extruded structure and notional load for Buckling analysis
Figure 3-11 (1). Extruded structure and notional load for Buckling analysisIt is important to create a plate element because with line one we cannot catch all the possible deformation of the beam. A notional load of 10 kN/m2 is applied on the top flanges (Figure 3‑11 (2)). Few analyzed modes are needed since usually, we are interested only in the first one.
.%20Extruded%20structure%20and%20notional%20load%20for%20Buckling%20analysis.png?width=734&name=Figure%203-11(2).%20Extruded%20structure%20and%20notional%20load%20for%20Buckling%20analysis.png)
Looking at the results we first check the resultant moment associated with the load we applied, calculated multiplying the normal forces by the distance from the center of the section.
This resultant moment must be multiplied by the minimum critical load factor among all the buckling modes, that we can find in buckling mode shapes (Figure 3‑13).
 Figure 3-12. Calculation of the resultant moment for the plate section
The minimum critical load factor, usually associated with the first mode, multiplied by the reference bending moment that we calculated, gives us the Elastic Critical Moment we looked for.
 Figure 3-13. Buckling mode shapes and critical factors
4. Double Tub Girder Solution
For making viable the single tub girder solution an excavation at the level of the lower National Road of 15 cm is needed. This makes the second proposed solution not applicable due to logistical problems and the excessive costs required for the work. To rise above the situation a double tub section has been proposed and accepted (Figure 4‑1): this solution has a high cost and weight, but gives the possibility to reduce the height of the deck package. Furthermore, to respect the available clearance requirement, we need to slightly modify the configuration of the intersection achieving a reduction of the central span to 40 m length.
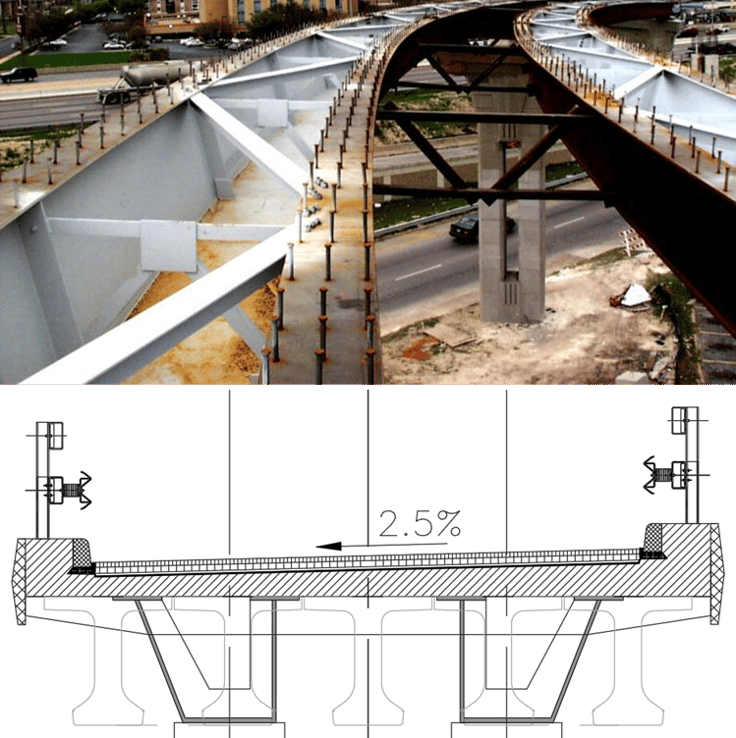 Figure 4-1. Double tub girder deck example and cross-section of the third solution
In this third model phases of execution will be analyzed. This kind of analysis is crucial for bridges since the way you plan to build the bridge can change in a significant way the resultant stresses in the elements. A delicate stage for composite bridges is the casting of the slab: in this phase, the deck is only metallic, so we can have various issues that would be ignored without studying the step by step structure, for example, the buckling problem previously discussed. The Eurocode 1-1-6 prescribes some loads to consider for the casting phase (Figure 4‑2), mainly we have the weight of the fluid concrete, the presence of workers, facilities, and formworks. This can be theoretically considered as a moving load since we don’t know the most onerous position for the working area: in midas Civil we could do this by converting this moving load in static through a specific function.
 Figure 4-2. Loads in the concrete-casting phase
In Figure 4‑3 we can give a look at the main load combinations considered: Eurocode 0 provides the ultimate limit state fundamental combination and the seismic one; combination coefficients for road bridges are provided by annex A1. Thermal uniform actions and gradients need to be combined too, using the factor provided by Eurocode 1-1-5. Furthermore, the main directions of the earthquake, marked as “A” in the seismic combination, are applied at the same time according to Eurocode 8.
 Figure 4-3. Load combinations and combination factors according to Eurocodes and Romanian Annex
In this model, piers are realized with a line element with a variable section in both directions through a tapered group (Figure 4‑4). The bridge has a non-common composite section, that has been created through a specific tool of Midas that is the Sectional Property Calculator, and then imported into the model as an SEC file.
 Figure 4-4. Third model and imported section properties
The slab is modeled as a plate element for a more accurate distribution of applied loads upon it. For this reason, in this case, the moving load optimization has been done with a surface load lane with a carriageway width of 4.5m (Figure 4‑5).
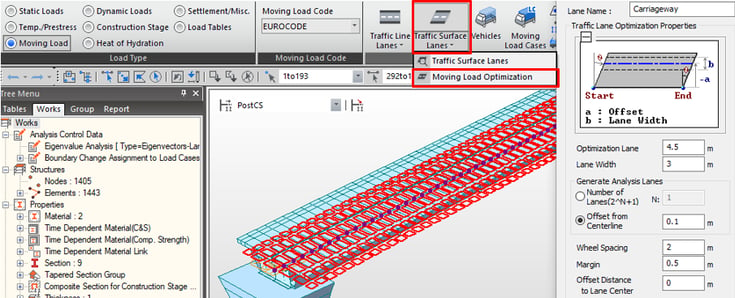 Figure 4-5. Moving Load Optimization with surface load lane
Permanent loads are applied as a surface load, while the loads in the phase of execution (Figure 4‑6) are applied directly on the beams because they will be activated before the slab. The one relative to the workers, having the minimum value in our case, is a simple uniform load of 0.75 kN/m2, distributed equally between the two beams.
 Figure 4-6. Loads in the phase of execution: fluid concrete and workers' load
Since the structure is a part of a bigger viaduct, the half lateral spans, which aren’t analyzed, are simulated with a nodal force. We can apply it on a node located where the supports are supposed to be, then connected to the pier with an elastic rigid link (Figure 4‑7).
 Figure 4-7. Application of the load for side spans and construction stages
We define four construction stages:
- a first stage, with a duration of 30 days (the time needed by the concrete to reach its resistance and became an effective element). In this phase, piers are built, and the other spans of the viaduct are installed;
- in Stage 0 we plan to cast the concrete of the slab. Here we have all metallic elements activated together with the links between the deck and the piers. Fluid concrete weight and the load due to workers are activated;
- in Stage 1 we activate the slab as an element. We can deactivate the loads in the phase of execution, activating instead the loads relative to the sidewalk on the last day;
- finally in Stage 2, we set a duration of 100 years to see the long-term effects, and in addition, we apply the wearing surface load.
Time-dependent effects must be taken into account especially for sections with parts in class 3 or 4 and for SLS checks since in these cases elastic analysis is required and so the history of construction stages has an effect on final stresses. The time-dependent effects of concrete can affect deformations, like Creep and shrinkage, and the resistance with the increase of compression strength in the first days after casting. Parameters in the input are code of reference, characteristic compression strength of the material, humidity, and notional size of the member. The age of beginning of shrinkage, according to Eurocode 4 part 2 is of 1 day. We have also defined the increasing of compression strength, entering the mean compression strength of the concrete: in Figure 4‑8 we see that we reach the full resistance in 30 days.
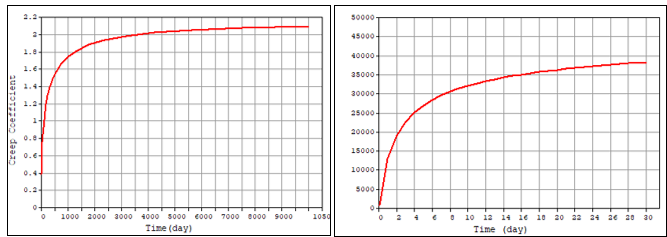 Figure 4-8. Creep and compression strength functions in time
To avoid that the simultaneous presence of the concrete part of the composite section and the slab element would bring us to a double stiffness, we eliminated the torsional inertia in transversal direction through the stiffness scale factor function (Figure 4‑9, left).
 Figure 4-9. Stiffness modifiers for the composite section and stiffness reduction of the slab in section with negative moment
The Eurocode 4 part 2 provides that for continuous bridges, due to the negative moment on supports that cracks the tensed concrete, we must not consider the stiffness of the slab on the 15% of the span on each side of internal supports. Then we are going to assign a zero stiffness through the plate stiffness reduction scale factor for these elements, defining a boundary group that is useful to define for which load cases, in the analysis settings, we are going to apply this modifier. In this case, we exclude the response spectrum analysis since it would not work properly otherwise (Figure 4‑9, right).
A little trick to save time when we need to create load combinations is to take them from an existing file, at the condition of using the same load cases names. Practically we can export the MGT file, copying the load combination part (Figure 4‑10) and pasting and running it in the MCT command shell. They will be automatically added by the program.
 Figure 4-10. Importing load combinations from an existing file
In Figure 4‑11 we can check the traffic load effect for a middle span element and for a lateral span one.
 Figure 4-11. Moving tracer maximizing moment for a middle span element and a lateral span element
We can check the summations of loads for each stage and finally the ULS combination effect and the seismic combination effect also.
 Figure 4-12. Results for ULS and Seismic combination
This was the last solution proposed and finally accepted by the client for the realization of the road passage. As we have seen midas Civil gives us the possibility to have a complete overview on different solutions, giving many options to choose the level of accuracy that we want to reach with our models and having the flexibility to explore many solutions to find the most efficient.
MIDAS Expert Webinar

![[Free Tools] Development & Splice Length Calculator (ACI318-19)](https://2495902.fs1.hubspotusercontent-na1.net/hubfs/2495902/EN_MIDAS%20BRIDGE/05.%20Resources/02.%20Bridge%20Blog/02.%20Contents%20Image%20File/06.%20Development%20Splice%20Length%20Calculator/%EB%A6%AC%EC%8A%A4%ED%8A%B8%20%EC%8D%B8%EB%84%A4%EC%9D%BC%20_Development%20&%20Splice%20Length%20Calculator%20%28ACI318-19%29.png)
![[Free Tools] Create drawings with just a few inputs – It's that simple!](https://2495902.fs1.hubspotusercontent-na1.net/hubfs/2495902/EN_MIDAS%20BRIDGE/05.%20Resources/02.%20Bridge%20Blog/02.%20Contents%20Image%20File/07.%20Auto%20drafter/%EB%A6%AC%EC%8A%A4%ED%8A%B8%20%EC%8D%B8%EB%84%A4%EC%9D%BC%20_Auto%20drafter.png)
![[Free Tools] Convenient Horizontal Earth Pressure Coefficient!](https://2495902.fs1.hubspotusercontent-na1.net/hubfs/2495902/EN_MIDAS%20BRIDGE/05.%20Resources/02.%20Bridge%20Blog/02.%20Contents%20Image%20File/05.%20Convenient%20Horizontal%20Earth%20Pressure/Earth%20Pressure%20Coefficient_List%20Thumbnail.png)
![[Free Tools] Europe Wind Zone Map: Find Basic Wind Velocity by Country (EN 1991-1-4)](https://2495902.fs1.hubspotusercontent-na1.net/hubfs/2495902/EN_MIDAS%20BRIDGE/05.%20Resources/02.%20Bridge%20Blog/02.%20Contents%20Image%20File/03.%20Basic%20Wind%20Velocity%20Map/Frame%203467383.png)
![[Free Tools] Rethinking Seismic Analysis: The Smarter Way with Response Spectrum](https://2495902.fs1.hubspotusercontent-na1.net/hubfs/2495902/EN_MIDAS%20BRIDGE/05.%20Resources/02.%20Bridge%20Blog/02.%20Contents%20Image%20File/02.%20RS%20Generator/Frame%203467388.png)


.png)
/Seismic%20Design%20of%20Concrete%20Bridges/Seismic%20Design%20of%20Concrete%20Bridges%20345%20240.png)
/Geometry%20Modeling%20Techniques%20for%20Bridge%20Engineers%20Seeking%20for%20More/Geometry%20Modeling%20Techniques%20for%20Bridge%20Engineers%20Seeking%20for%20More.png)